An Introduction to CT
22 Sep 2018If you want to see inside something, an object, a person, a pet … there are a few ways you can do that. I’m personally a huge fan of taking things apart to find out how they were put together - but it’s not entirely the best approach to finding out what’s inside your cat. Maybe you’d want something a little less destructive. If you have an X-ray machine you can shoot some X-rays through your cat and see how many come out the other end. That’s great for 2D images but cats are notoriously three dimensional so your X-ray will actually be all your cat’s 3D bits stacked on top of each other to the point where it takes some real skill to interpret. That’s why Radiographers and Radiologists get paid the big bucks, right?
So … you want a 3D image of the inside of your 3D thing. Reasonable … I guess. Most people would use ultrasound, magnetic resonance imaging or X-ray computed tomography:
- Ultrasound is where you send high frequency sound waves into your subject and listen to the response. Listen for how long it takes to come back and for changes in the returned sounds. You can build a 3D image with this but the quality will never be great.
- Magnetic resonance imaging is a kind of witchcraft with insanely powerful magnets. Literally strong enough to turn all your hydrogen atoms to point in one axis. That’s the thing though, it only works where you have a lot of hydrogen. It might be the universe’s most common element but it’s also a surprising limitation if you’re wanting to work with anything that’s very dead. Also, metals interact in unpleasant ways in big magnets.
- So … Computed Tomography
Computed Tomography
Going back to the cat… If you take an X-ray of your cat you have an idea of opacity (how many X-rays are absorbed) of everything in your cat, at that particular angle. You can get way more information by taking X-rays from every angle around the cat.
Geometry
As the saying goes: There is more than one way to skin a CAT scan. Likewise there are a few ways to take your X-ray images for CT:
- Parallel beams
- Fan beams
- Axial progression
- Helical / Spiral progression
- Cone beam
Here we are only talking about the arrangement of the X-ray beams as they pass through the object. The reason why will be come clearer later. One thing to note is that in that list the geometries are ordered from hardest to easiest to acquire the images, but conversely, easiest to hardest to reconstruct into the 3D images.
Sinogram
The sinogram (or radon transform) is the way we organise the information which relates to one slice of our 3D image. It is simply a stack of the 1D images through our interesting slice. Each new row of the sinogram is a 1D image at a different angle through the subject.
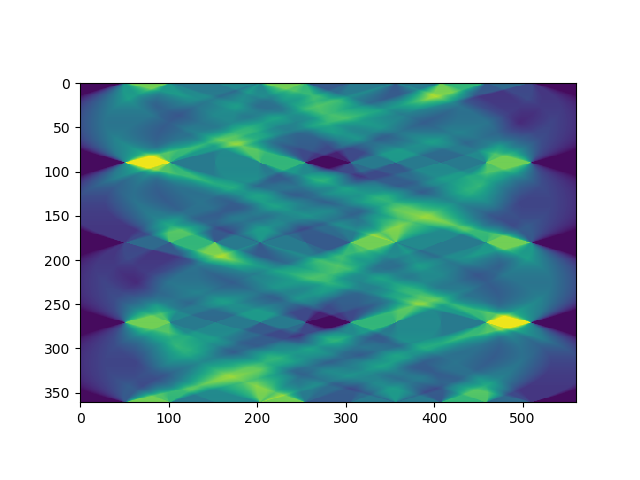
It is handy to organise the information in this way because in fan and parallel beam geometries each sinogram contains all the information for a single slice. If you have 50 slices, you have 50 sinograms. They’re very easy to process into this form too.
Back-projection
A sinogram is made up of projections through your subject. Back-projection is where you take your 1D images from your sinogram and kind of smear it back into a 2D image at the angle it was originally taken at:
Rinse and repeat for every angle, every row of your sinogram.
Keep stacking the back-projections on top of each-other and this is what you get:
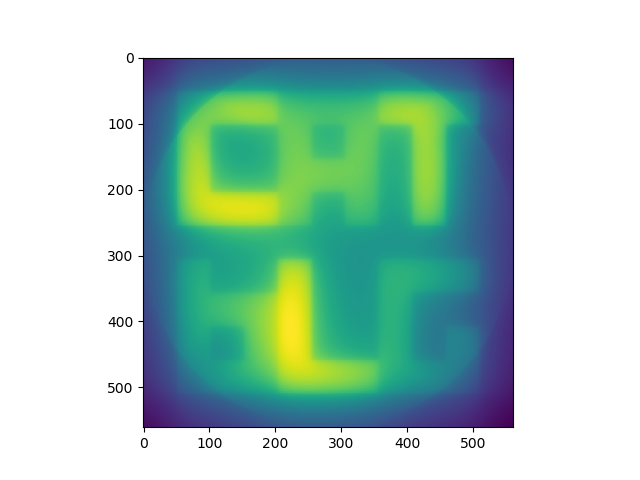
It’s worth noting that this is a computationally intensive process. Effectively applying a rotation to an image for every angle. For high resolution images you might have 2000+ projections for every slice.
So, being a bit critical, you can see this isn’t exactly the sharp and sexy slice through our 3D object that we started with. To get nice images you have to do a little more work.
Filtered Back-projection
That extra bit of work is simply applying a special filter to the sinogram before back-projection. A few of the commonest ones are:
- Ramp filter
- Shepp-Logan
- Cosine
- Hamming
- Hann
This sinogram has the Shepp-Logan filter applied:
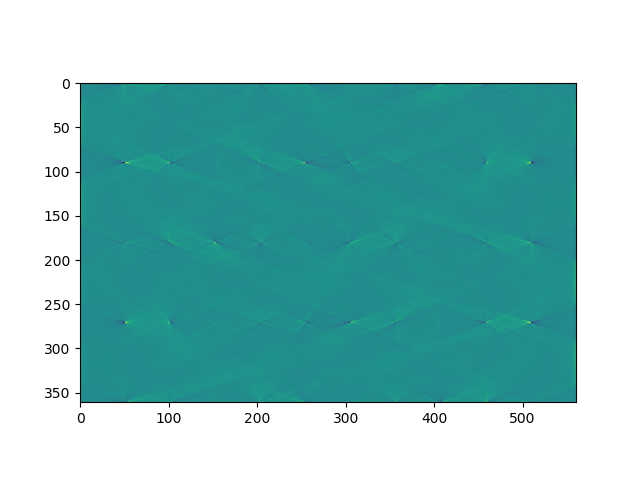
These are applied in the frequency space by first applying a Fourier transform, applying the filter, then returning the image to the spacial realm. There are libraries that do this very fast and very accurately.
And this is the result:
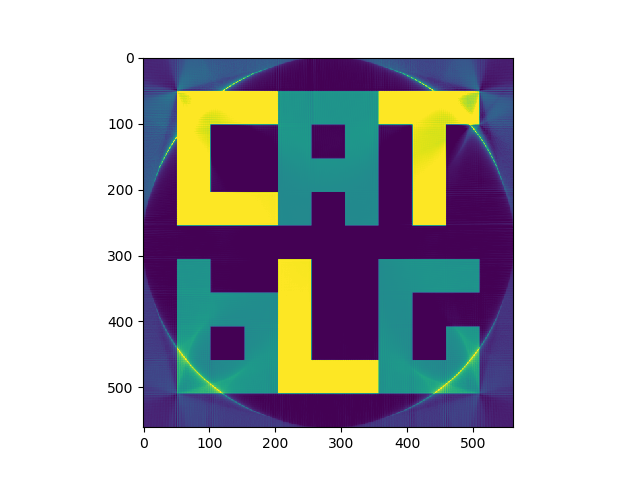
Compared to the original mathematical phantom:
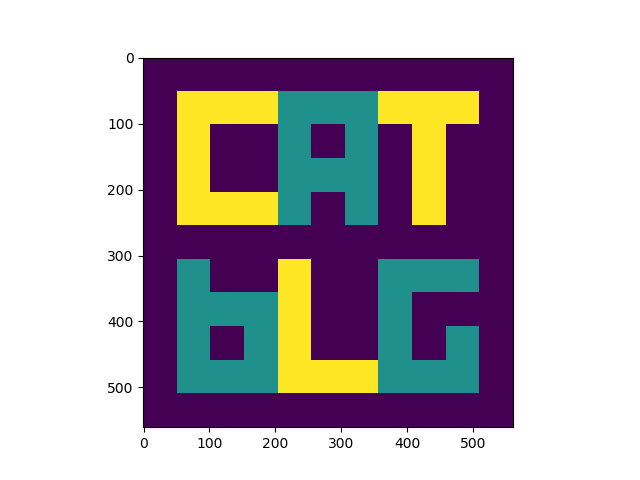
Note: All these images are false coloured.
